


When Science Gets “Too Positive”: What p-Hacking Is and Why It Matters
How small statistical choices can create big, misleading headlines—and what we can do instead.

Last week, I gave a guest lecture about p-hacking to a research methods class at the University of Notre Dame. The class seemed to find it useful, so I wanted to share some of the main takeaways in my newsletter! p-hacking refers to the practice of massaging data or analyses until a statistically significant result appears—usually defined as a p-value less than 0.05. A p-value is a number that helps you decide whether the results of a study or experiment are likely due to chance or reflect a real effect. So, a p-value of 0.05 means there is only a 5% chance that your results happened just by random luck (assuming there’s no real effect).
p-hacking doesn’t always mean overt fraud. Many researchers may p-hack unintentionally through disorganized research plans. But even subtle analytical flexibility can lead to false positives—results that appear “real” but aren’t.
How p-Hacking Works
Let’s say a researcher runs 20 different statistical tests. Even if there’s no real effect in any of them, one result will likely appear significant just by chance. Again, that’s how p-values work: a p-value of 0.05 means there’s a 5% chance of seeing that result if nothing is actually going on.
Common forms of p-hacking include:
Stopping data collection once results cross the p < .05 threshold
Trying multiple statistical models and only reporting the best one
Selectively removing outliers
Rewriting the hypothesis after seeing the data (HARKing: Hypothesizing After Results are Known)
This makes it easy to publish findings that look solid but are really just statistical noise.
p-hacking examples
In a widely cited paper titled “False-Positive Psychology” (Simmons, Nelson, & Simonsohn, 2011), researchers showed just how easy it is to generate false findings using standard tools of psychological science. In one example, they found that listening to The Beatles' song "When I'm Sixty-Four" made participants younger. Obviously not true—but they used real participants, real stats, and real methods. The trick? They exploited just a few small flexibilities that are all too common in research:
Flexible use of covariates: They only reported the analysis with a covariate (father’s age), which made the result statistically significant (p = .040). Without it, the effect was smaller and not significant (p = .33).
Selective variable reporting: They collected numerous variables (like feelings of age, political orientation, and even responses to trivia questions) but only reported the ones that produced a significant result.
Optional stopping: They didn’t pre-register or decide in advance how many participants they’d collect. Instead, they checked for significance every 10 participants, stopping when they got a p-value under .05.
During my talk, I also used this online tool to demonstrate how easy it is to p-hack various results for the economic impact of different political parties in power. For example, the data in this tool shows that Republican presidents have a significantly negative effect on the economy when looking at unemployment, inflation, and stock prices.
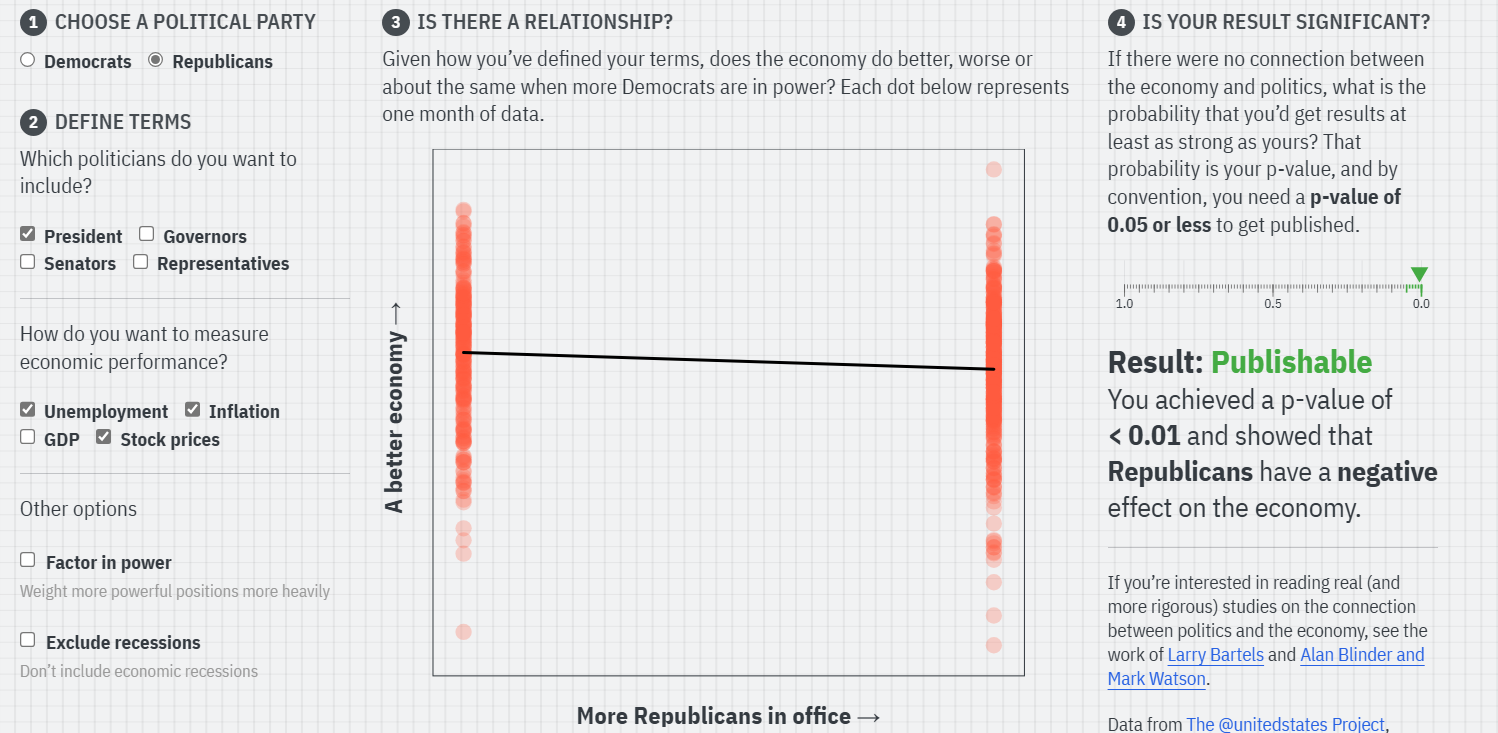
However, if you exclude recessions or add in GDP metrics, then the significant effect goes away! When looking at Democrats, you can see that Democratic presidents have a significantly positive effect on the economy when accounting for unemployment, inflation, and stock prices. But this effect reverses when you include having more Democratic Governors in office! Thus, this tool highlights the critical role of theory and building off of previous research when making your hypotheses. If you are going to make an economic argument based on politics, then it should be grounded in other research, not just looking at data after the fact.
The Bigger Problem: When False Positives Go Public
p-hacking is a major issue with the replication crisis in psychology and other fields. Scientists and academics have an incentive to publish novel and positive results in journals, which may influence how they write up their papers. And it doesn’t just damage reputations—it undermines the very credibility of evidence-based policy and public health. Studies that make bold claims often get media attention. But when follow-up studies fail to replicate those results, this hurts public trust in science.
How We Fix This
Simmons et al. proposed six simple rules to reduce false positives that still apply today:
Decide in advance when to stop collecting data
Report all measured variables—not just the ones that “worked”
Report all experimental conditions
Share results with and without covariates
Make raw data available when possible
Clearly label exploratory analyses
These practices don’t stop curiosity or creativity. They make it easier to separate real effects from noise—and to build cumulative, credible science. As I wrote before, the self-correcting nature of science helps build trustworthiness, despite the flaws of scientific institutions, which are full of human scientists (and their own flaws). Additionally, we can look at other statistical measures (such as effect sizes and confidence intervals) that help provide a more comprehensive picture of our results instead of focusing too much on p-values.
Final Thoughts
p-hacking can be tempting when systems fixate on novelty and statistical significance. But the long-term cost is steep: eroded public trust, wasted resources, and a distorted picture of reality. Fortunately, there is another path that helps us stay more grounded in reality. Transparent methods, well-informed research questions from previous work, and no over-reliance on a single statistic (or single study) can help science become more trustworthy, more accurate, and ultimately, more useful.